Analytics
Know which placement actually worked.
Follow people from scan to page to lead, compare every code and placement, and trust the numbers — bots, link previews and your own test scans are left out.

Why it works
What makes it different
Honest by design
Every number has a definition, excluded traffic is shown by reason, and comparisons never invent a trend.
From scan to outcome
Funnels connect scans, page views, form steps and leads, and tell you what they couldn't follow.
Private by default
No IP addresses of people who scan are stored. Country is reliable, city is approximate, and strict privacy mode turns finer detail off.
Analytics
Everything that's included
Every item below works in the app today.
Analytics
Honest numbers about what people did, and which placement made it happen.
- Scans, link opens, page views, form steps, taps, responses and contacts saved
- Funnels from scan to page to lead
- Campaign and placement comparison, code by code
- Bots, link previews and your team's test scans left out, and shown separately
- Custom date ranges in your time zone, with a fair comparison to the previous period
- Conversions reported by your own site, kept per currency
- PDF reports, CSV exports and scheduled reports
- A clear definition behind every number
- Retention settings and a strict privacy mode
See it in the app
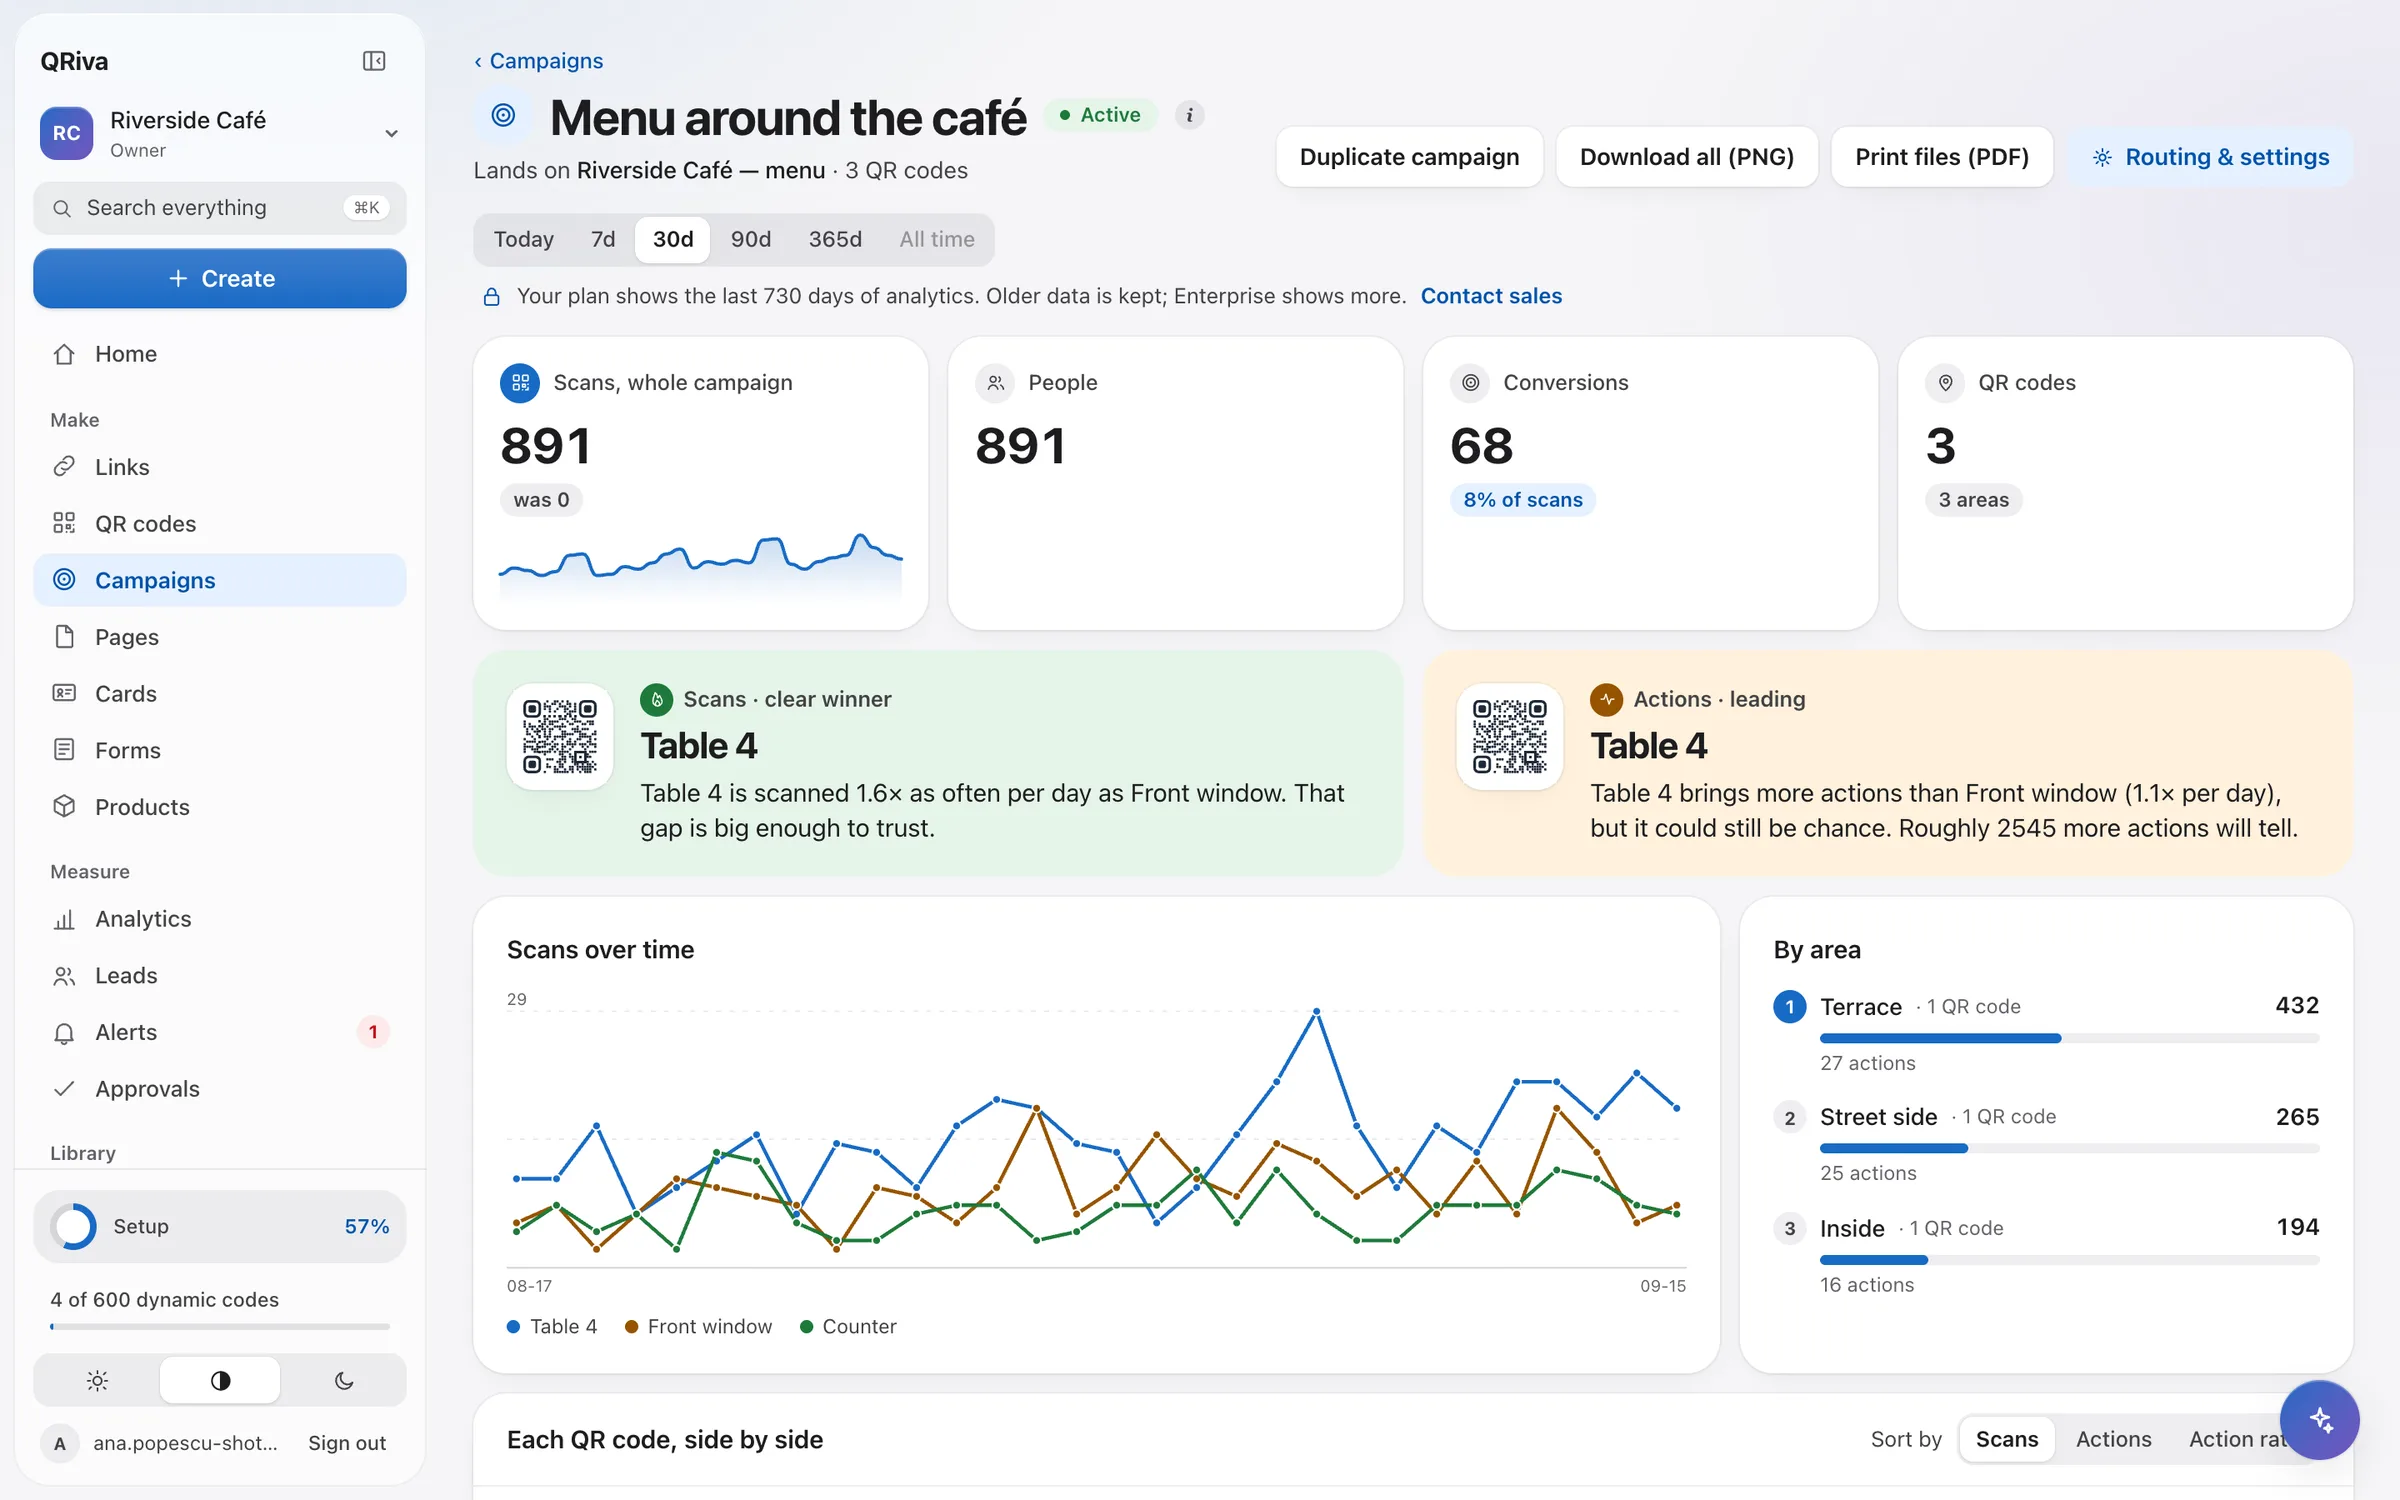
Analytics
Where it works well
Typical ways to use it. Illustrations of a kind of business, not customer stories.
- Example
Which table, which poster
Compare placements code by code and see which spot brought leads, not just scans.
- Example
Reports for clients and teams
PDF reports, CSV exports and scheduled reports, and white-labelled report links for clients.
- Example
Your own site's conversions
Add a small first-party snippet to your site and see the purchases or sign-ups that followed a scan, per currency.
Pricing
What each plan includes
Straight from the plan comparison, which is exactly what the app enforces.
| Included | Free | Starter | Pro | Company | Enterprise |
|---|---|---|---|---|---|
| Analytics history | 30 days | 90 days | 1 year | 2 years | Unlimited |
| Funnels, campaign comparison and PDF reportsFrom scan to page to lead, per placement. | Not included | Not included | Included | Included | Included |
| Scheduled e-mail reportsThe same numbers, delivered on a schedule. | Not included | Not included | Not included | Included | Included |
| CSV exportsCodes, links, leads and form responses. | Not included | Included | Included | Included | Included |
Questions
Frequently asked questions
How do you count unique visitors without IP addresses?
Are bots and link previews counted?
How far back can I see?
Can I export my data?
Try it free today.
Start on the Free plan — no card needed. Upgrade when you need more.